New in Version 24.3
A note about the graphs in the BPTrakr Free Edition
Please note that the BPTrakr Free Edition displays the graphs with a digital watermark with the words “BPTrakr – Upgrade To Pro Edition”. Graphs shown in the BPTrakr Pro Edition do not contain this watermark. To learn more about the BPTrakr Pro Edition and it’s pricing go to the BPTrakr product page.
How to view the Weight to Body Mass Index (BMI) Zones Graph
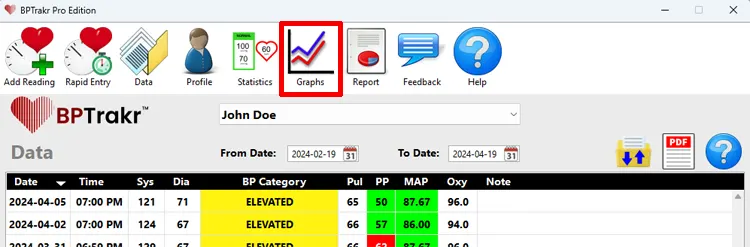
Step 1: On the toolbar, click on the Graphs button. The Graphs screen will appear.
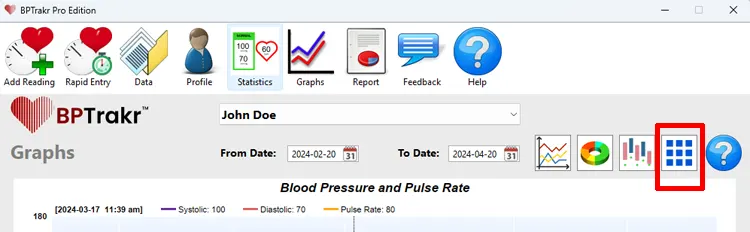
Step 2: On the Graphs screen, click on the More Graphs button. The More Graphs window will appear.
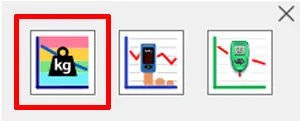
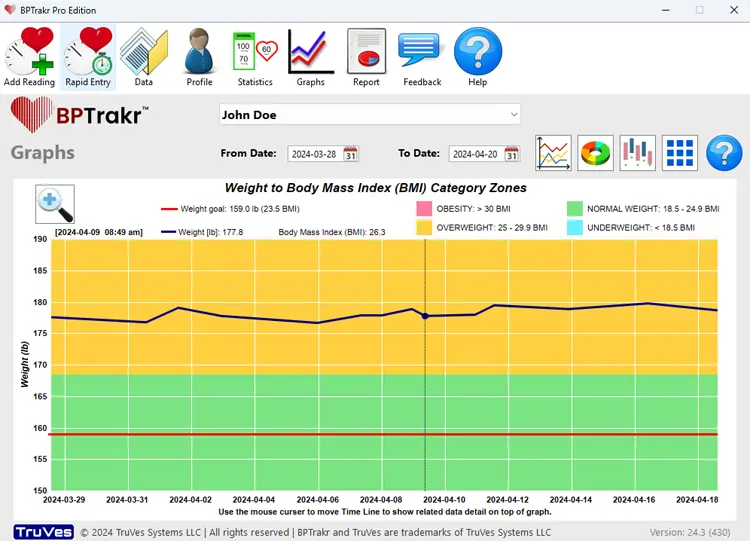
Step 3: On the More Graphs window, click on the Weight to Body Mass Index (BMI) Zones Graph button. The Weight to Body Mass Index (BMI) Zones Graph will appear.
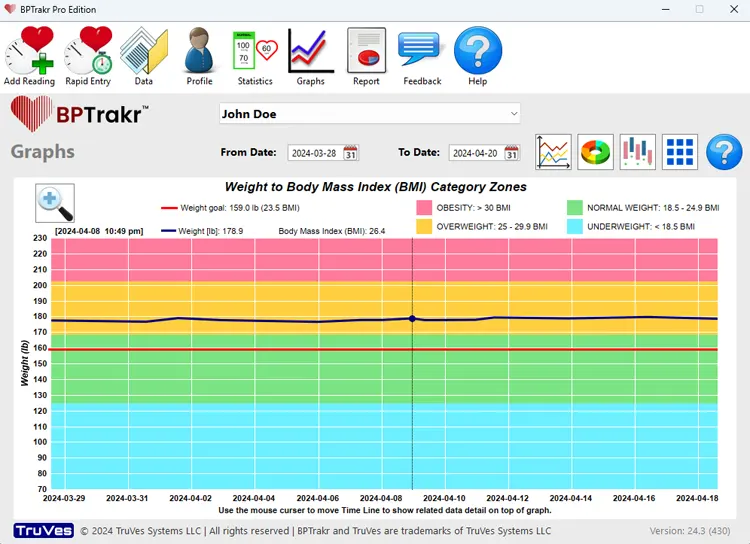
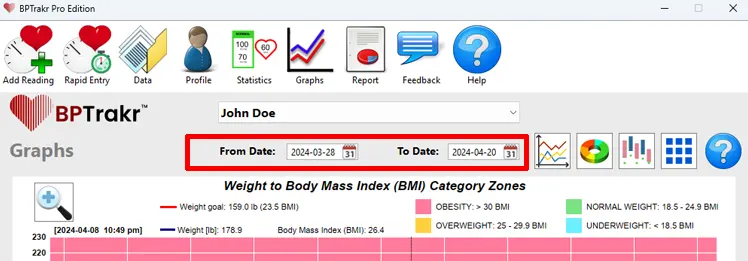
Step 4: If desired, you can change the range of data for the graph by clicking on the date fields to change the date range of the data.
How to use the Zoom View feature
The Zoom View for Graphs feature allows the user to see a more detailed view of the graph data. The Zoom View tool is accessible for the Weight to Body Mass Index (BMI) Zones Graph. This feature is available only when you upgrade to BPTrakr Pro Edition.
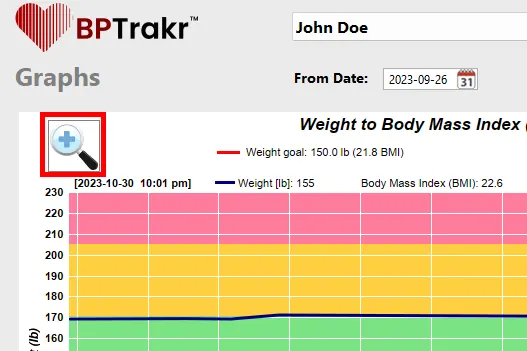
Step 1: On the Graphs screen, with Weight to Body Mass Index (BMI) Zones Graph selected, click on the Zoom View button. The Zoom View window will appear.
Step 2: On the Zoom View window, use the left and right arrow keys or the mouse to move the slider. Moving the slider to the right (Zoom In) will show more graph detail. Moving the slider to the left (Zoom Out) will show more category zones within the graph. After adjusting the desired zoom setting, click the OK button. 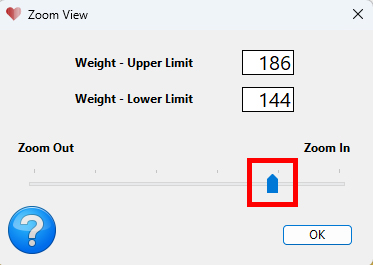
The resulting graph view will depend on the selected Zoom View settings.
See also
- Viewing the Blood Pressure and Pulse Rate Line Graph
- Viewing the Blood Pressure Category Donut Graph
- Viewing the AM vs PM Measurement Comparison Graph
- Viewing the Blood Oxygen Saturation Levels Graph
- Viewing the Blood Glucose Levels Graph